

Movement & Shift in Demand
Quantity demanded of a commodity is determined by various factors. As all other factors except the price remain constant, a change in price brings in an extension or contraction in demand for a commodity. It causes the combination between the price and quantity demanded, move up or down along the same demand curve. On the other hand, if the price except all other factors remains constant a change in any other factors brings an increase or decrease in demand for a commodity. It causes the combination between the price and quantity demanded shift to the right or the left with a demand curve. This is how a movement along and shift in a demand curve both operate, with a change in the determinants of demand.
1-Movement Along a Demand Curve
If all the determinants except the price remain constant, a change in the price of a commodity brings a change in its quantity demanded. It causes the combination between the price and quantity move upward or downward along the same demand curve. The movement of price-quantity combination upward or downward is known as a movement along a demand curve. When it moves upward with a rise in the price, is is called contraction in demand and on the other hand it is called extension or expansion if it moves downward with a fall in the price. The movement along a demand curve is illustrated below by the demand schedule and diagram.
Demand Schedule-1
|
Px |
Qdx |
Combination |
Movement |
|
$15 |
4 Kg. |
A |
Contraction (Upward Movement) |
|
$10 |
8 Kg. |
B |
Initial Demand Position |
|
$5 |
12 Kg. |
C |
Extension (Downward Movement) |
In the above demand schedule, let us suppose that B is the initial price-quantity combination where demand is 8Kg. at the price $10 per Kg. As the price falls to $5, the quantity demanded expands to 12 Kg. where the price-quantity combination is denoted by C. If the price rises from $10 t0 $15 the quantity demand contract to 4 Kg. where the price-quantity combination is denoted by A. Here, the combinations A and C move up and down with the change in price.
The movement along a demand curve is also illustrated by plotting the demand schedule in a diagrammatical form as,
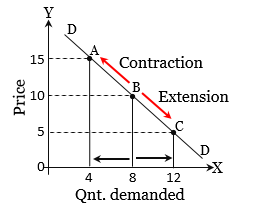
In the diagram, it is supposed that the price-quantity combination denoted by B is the initial combination on the demand curve DD. If all factors except price remain constant, the quantity demanded contracts from 8Kg. to 4Kg with a rise in the price from $10 t0 $15 and its price-quantity combination denoted by A moves upward from the point B along the same demand curve DD as shown in the diagram. On the contrary, if the price falls from $10 to $5, the quantity demanded extends to 12Kg. from 8Kg. and its price-quantity combination denoted by C moves downward from the point B along the same demand curve as shown in the diagram. This is how the price-quantity combinations move upwards or downwards along a demand curve when all the determinants except price remain constant.
2- Shift in Demand curve
If all the determinants except the price get changed, there is also a change in quantity demanded of a commodity. As a result, there is an increase or decrease in demand for the commodity. Due to change in other determinants, the demand curve shifts forward with an increase in demand and it shifts backward with a decrease in demand. Such a shift with an increase or decrease in quantity demanded due to change in other determinants except the price is called a shift in demand curve. The shift demand curve is illustrated below by the demand schedule and diagram.
Demand Schedule-2
Px | Qdx | Combination | Shift |
$10 | 4 Kg. | A | Decrease (Backward Shift) |
$10 | 8 Kg. | B | Initial Demand curve |
$10 | 12 Kg. | C | Increase (Forward Shift) |
In the above demand schedule, let us suppose that B is the initial price-quantity combination where demand is 8Kg. at the price $10 per Kg. As the income of the consumer increases, at the same price the quantity demanded increases to 12 Kg. where the price-quantity combination denoted by C. If the income of the consumer falls, even at the same price $10, the quantity demand decreases to 4 Kg. where the price-quantity combination denoted by A. Here, the combinations A and C represent decrease and increase in demand with the change in other determinants but not in the price.
The shift in demand curve is also illustrated by plotting the above demand schedule in a diagrammatical form.

In the diagram, it is supposed that the price-quantity combination denoted by B is the initial combination on the demand curve D2D2. let us suppose that the income of the consumer increases. As a result, the quantity demanded increases from 8Kg. to 12Kg at the given price $10. Therefore its price-quantity combination denoted by C shifts forward from the point B resulting a shift in demand curve D2D2 to D3D3 as shown in the diagram. On the contrary, if the income of the consumer falls, at the same price $10, the quantity demanded decreases to 4Kg. from 8Kg. and its price-quantity combination denoted by A shifts backward from the point B resulting a shift in demand curve from D2D2 to D1D1 as shown in the diagram. This is how the price-quantity combinations shifts forwards or backwards with a demand curve when all the determinants except price get changed.
3- Causes of Shift in Demand Curve
The quantity of a commodity that is demanded by a consumer is influenced by various factors like the price of own commodity, income of the consumer, the price of related commodity, cultural and traditions, size of population and by many of others. If any of the factors except the price get changed, a demand curve shifts to forward or backward from the initial position. Some factors which are responsible for a shift in demand curve have been mentioned here.
3.1- Change in Income
A change in income of a consumer causes a forward or backward shift in demand curve. When the income of the consumer increases, his purchasing power also increases. As a result, he can demand a higher quantity of the commodity at the same price and causes the demand curve shifts forward. On its contrary, with a fall in income of the consumer, he can demand only a smaller quantity of the commodity which causes the demand curve shift backward. Thus, a demand curve shifts to forward or backward due to change in income of a consumer.
3.2- Change in Prices of Related Commodity
A change in the price of related commodity also causes a shift in demand curve. when the price of a commodity changes, the demand for its substitutable commodity increases or decreases and the demand curve shifts forward or backward. For instance, if the price of coffee increases, the demand for its substitutable commodity tea, increases because the coffee-consumers switch to tea and the demand curve of tea shifts forward. On the contrary, with a fall in the price of coffee, demand for tea becomes comparatively costly and its demand falls. Hence, the demand curve of tea shifts backward. The shift in the demand curve occurs here due to change in the price of its substitutes, not due to change in its one price.
Similarly, when the price of a commodity changes, the demand for its complementary commodity increases or decreases and the demand curve shifts forward or backward. For instances, if the price of ink increases, the demand for its complementary a pen, decreases because using a pen becomes comparatively costly and the demand curve of a pen shifts backward. Conversely, with a fall in the price of ink, demand for a pen increases and the demand curve shifts forward. The shift in demand curve of the pen is caused here, due to change in the price of its related commodity ink, not in its own price.
3.3- Change in Consumers Preference and Taste
This consists of change in fashions, customs, habits etc. If a consumer finds a commodity more tasty to him or her, its demand increases without any change in its price and the demand curve shifts forward. On the contrary, if it is felt him or her less tasty its demand decreases and the demand curve shifts backward. Likewise, if any commodity exists on fashion, its demand also increases and when it goes out of fashion, its demand decreases. The former causes the demand curve shift forward and the later one shifts it backward.
3.4- Advertisement
A shower of an advertisement of a commodity motivates consumers positively towards the commodity. Hence its demand increases and the demand curve shifts forward. On the contrary, commodity without advertisement gradually loses its consumers and its demand decreases where the demand curve shifts backward. It all happens without any change in the price of a commodity. Hence, advertisement also causes a shift in demand curve.
3.5- Change in Size of Population
A change in size of population causes a an increases or decrease in demand for a commodity and the demand curve shifts forward or backward. An increase in size of population causes demand for a commodity soar up and the demand curve shifts forward. On the other hand, with a fall in size of population, demand for a commodity goes down and the demand curve shifts backward. Hence, change in size of population is responsible to cause the demand curve shift.
3.6- Change in weather and Season
A change in weather and season also causes demand curve shift forward or backward. When a weather and season change, demand for goods also get changed without any change in the price. For example, if it starts to rain continuously, demand for umbrellas and rain-coats instantly increases and the demand curve shifts forward and vice-versa. Similarly, in winter season demand for woolen clothes soars up and in summer their demand completely falls down. So their demand curves shift accordingly. The change in demand occurs here due to change in weather and season but not in change in their prices.


0 Comments